genogeographer comes with three reference databases genotyped with Applied Biosystems Precision ID Ancestry Panel, which contains 165 Ancestry Informative Markers (AIMs) SNPs (AISNPs) selected by the Kidd and Seldin labs, respectively. One locus (rs10954737) was excluded the databases as it is underrepresented in several of the publicly available population samples used to form the reference databases.
Below are tables of the included populations and the induced metapopulations. The latter groups of populations identified using STRUCTURE (see STRUCTURE analysis) and other population genetic analyses (see Mogensen et. al, 2020, for details).
All 164 AIMs can be used for analyses, but also the so-called 'Kidd' (55 markers) and 'Seldin' (122 markers) subsets of markers can be used. For all three sets of markers analses can be performed using the individual populations or metapopulations, and in both cases either as non-admixed or admixed (first-order admixture of two distinct (meta-)populations).
See AIMs information for specific details on the AISNPs and their allelic variants.
The table below contains an overview of the AIMs SNPs included in the reference databases. For more information on the individual SNP a link to the National Library of Medicine' dbSNP is provided.
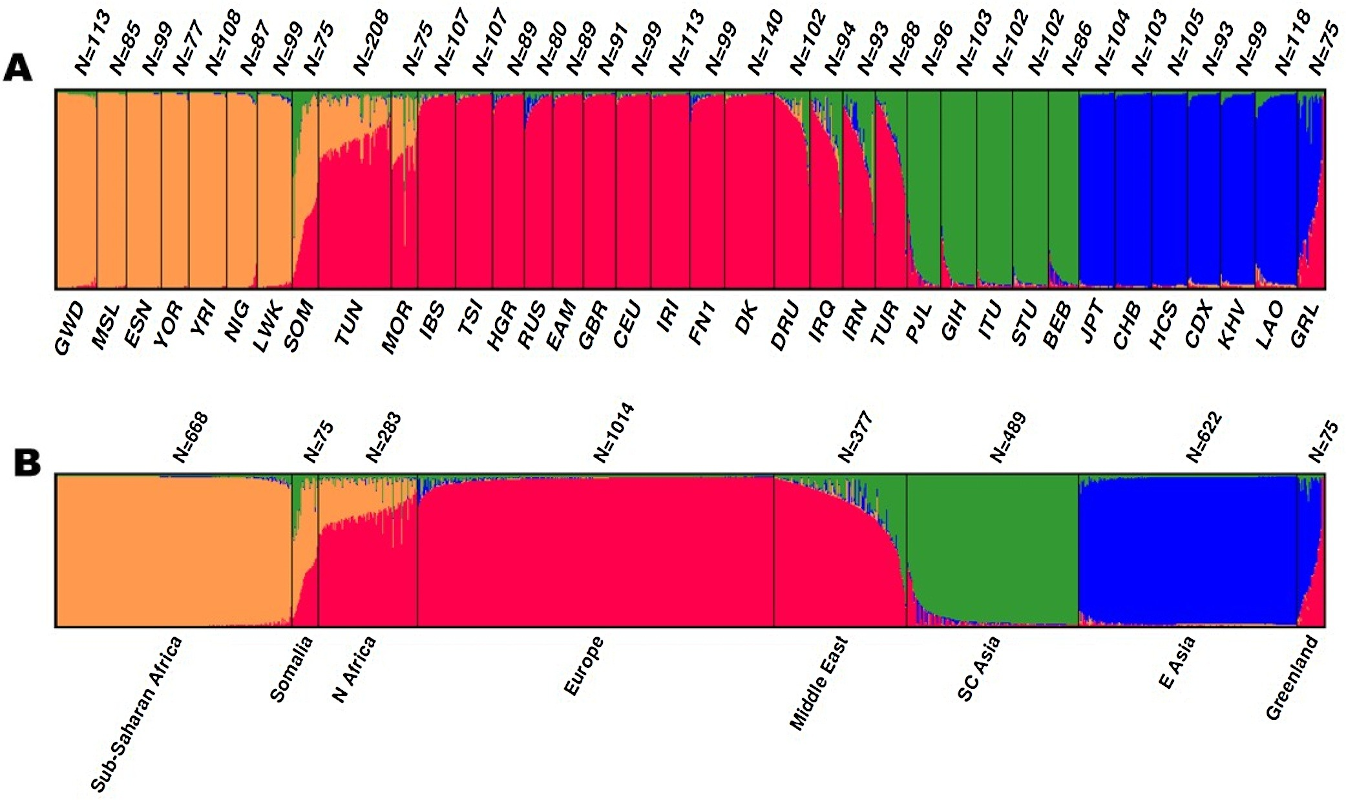
Based on a STRUCTURE analysis (and other population genetic analyses, see Mogensen et. al, 2020, for details) the individual populations were grouped into metapopulations. The metapopulations were identified by similar STRUCTURE cluster membership components and by no or a limited number of significant allele frequency differences among the included populations.
The STRUCTURE plot below originates from Mogensen et. al (2020).

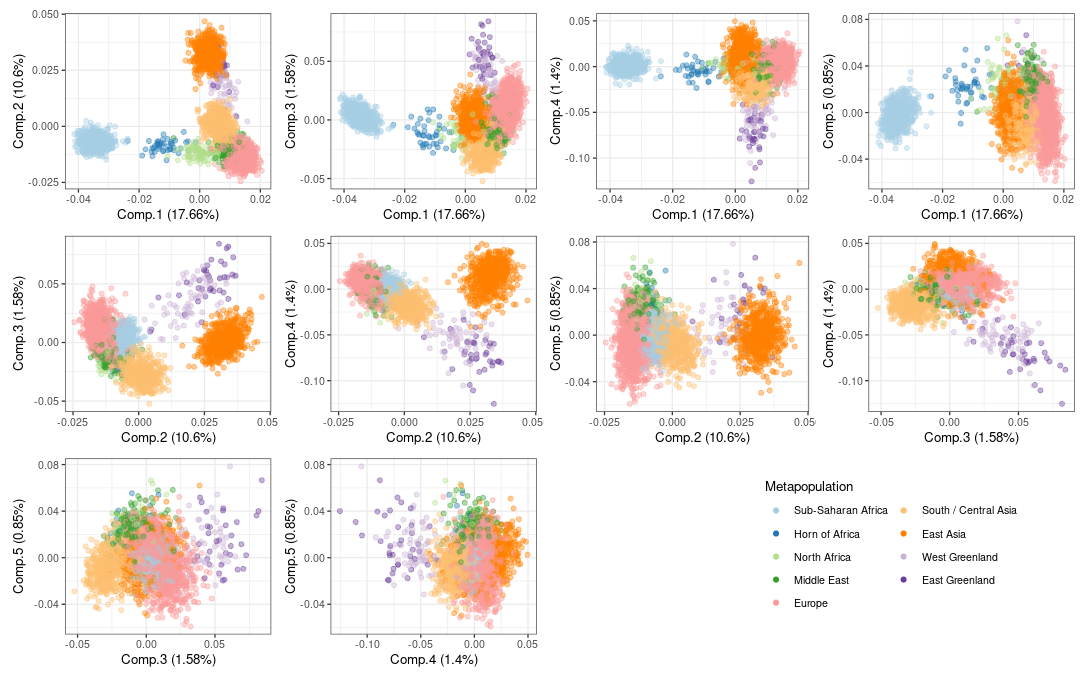
The plot below shows the outcome of a principal components analysis of the genotypes included in the reference databases. The colours are determined by the metapopulations. An analysis similar to EIGENSTRAT identified that the first five eigenvalues were significant in order to infer population structure. Thus the pairwise combinations of the first five PCs are plotted below to show the population structure in the reference databases.

The Genogeograher is an implementation of the methodology described by Tvedebrink et al. (2017, 2018, 2019) and benchmarked in Mogensen et al. (2020). The aim is to classify an individual into a list of reference populations based on the individual's genotype. To this purpose ancestry informative markers (AIMs) are used, which (typically) are biallelic SNPs with pronounced observed variation across geography, ethnicity or culture
The genogeographer methodology is similar to an outlier test, where a genotype is tested for being an outlier in each of the references populations. Hence, an individual can be rejected in all populations or accepted in one or more populations. The key point is that a genotyped profile can be rejected in all populations if it is too different from the typed reference populations. In an ordinary classification approach, the genotyped profile would be assigned to the least unlikely (or most probable population). That is, the reference populations are exclusive, but not exhaustive, which may cause the conclusions to be wrong.
User guide
A user guide is available here .
Version
This Genogeograher online app is implemented in R with a frontend in Shiny. Care is taken in the implemenation, but the app comes with absolutely no warranty.
The app is implemented by Torben Tvedebrink <genogeographer@tvedebrink.dk>.
The app is based on genogeographer version 0.3.1 and associated reference databases.
References
- T Tvedebrink, PS Eriksen, HS Mogensen, N Morling (2017). GenoGeographer - A tool for genogeographic inference. Forensic Science International: Genetics Supplement Series 6, e463-e465.
- T Tvedebrink, PS Eriksen, HS Mogensen, N Morling (2018). Weight of the evidence of genetic investigations of ancestry informative markers. Theoretical Population Biology 120, 1-10.
- T Tvedebrink, PS Eriksen (2019). Inference of admixed ancestry with Ancestry Informative Markers. Forensic Science International: Genetics 42, 147-153.
- HS Mogensen, T Tvedebrink, C Borsting, V Pereira, N Morling (2020). Ancestry prediction efficiency of the software GenoGeographer using a z-score method and the ancestry informative markers in the Precision ID Ancestry Panel. Forensic Science International: Genetics 44, 102154.